Hi everyone,
Here the results of my performance analysis of the P-47D.
As an introduction, let me point out that it's only possible to calculate the performance of a specific aircraft type when you have data on the power curve on the engine that powers this aircraft. In the case of the P-47, this was made difficult because the US system of rating engines pretends that the R-2800 yields constant power from sea level to critical altitude, while in combat use, the aircraft is flown with constant boost level up to critical altitude, which yields a not-so-straight power curve that shows a power maximum at medium altitude, with less power at the top and bottom end than you'd believe from the rating.
Since Mike Williams has provided some very good reports on the P-47 that were prepared by measuring the actual engine power in flight with a torquemeter (neat bit of technology!), I was able to approximate the power curve for static conditions (since at top speed in level flight, ram effect increases the intake pressure) and make a better analysis than my previous "constant rated power" attempts with Mike's data from P-47 Performance Tests
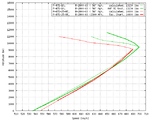
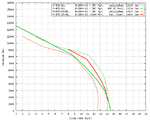
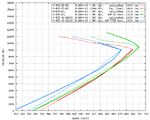
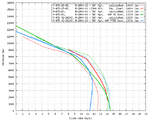
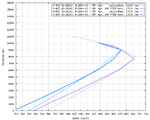
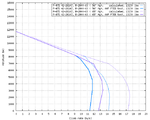
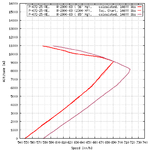
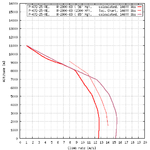
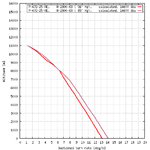
Here is a comparison of real-world data for the P-47D-10 equipped with a torquemeter and the data I calculated from the reverse-engineered static power graph, plus real-world data from the Tactical Chart for the P-47D-25RE and how it compares to the calculation I prepared using the same reverse-engineered power chart.
The fit of the P-47D-10 curves is fairly good. (In fact, I'm very happy with it.) The remaining difference could be due to two or three factors I consciously neglected while reverse-engineering the power chart to keep the complexity at a managable level.
Applied to the P-47D-25-RE, the same power chart yields a very satisfying fit. (In fact, I was surprised when it came out so well.)
Note the wavy form of the speed and climb calculation above critical altitude - this is the result of applying the measured torquemeter values. The charts that come with the reports on Mike's site don't show this wavy form, but how you get a smooth graph from a wavy power curve ... well, I assume they just smoothed it over.
The fit of the climb curves is more interesting. The P-47D-10 curve is correct in magnitude but doesn't have the correct shape. (Minor differences are to be expected as the torquemeter didn't yield exactly the same power curve in climb as in level flight, but I don't think these are responsible for the whole difference.) The P-47D-25-RE curve is great in its shape (though I changed one digit of a single figure from the Tactical Chart because it was an obvious typo), but about 1 m/s too low. Funny, but that both differences go the opposite way is somewhat encouraging ... more in my next post.
(The P-47D-10 is a razorback with the small-diameter "toothpick" propeller, while the P-47D-25-RE has a bubble canopy and the the large-diameter "paddle blade" propeller.)
Regards,
Henning (HoHun)

