Weather Radar

Ad: This forum contains affiliate links to products on Amazon and eBay. More information in Terms and rules

Fenton

Recruit
4
0
Jan 13, 2011
Hello! guy's

I want to sharing with you some information about, what is weather radar..? and how its work...? A weather radar, is a type of radar used to locate precipitation, calculate its motion, estimate its type (rain, snow, hail, etc.), and forecast its future position and intensity...I hope you will got it...
 
Weather radars send directional pulses of microwave radiation, on the order of a microsecond long, using a cavity magnetron or klystron tube connected by a waveguide to a parabolic antenna. The wavelengths of 1 to 10 cm (4 in) are approximately ten times the diameter of the droplets or ice particles of interest, because Rayleigh scattering occurs at these frequencies. This means that part of the energy of each pulse will bounce off these small particles, back in the direction of the radar station.

Shorter wavelengths are useful for smaller particles, but the signal is more quickly attenuated. Thus 10 cm (4 in) (S-band) radar is preferred but is more expensive than a 5 cm (2 in) C-band system. 3 cm (1 in) X-band radar is used only for very short distance purposes, and 1 cm (0.4 in) Ka-band weather radar is used only for research on small-particle phenomena such as drizzle and fog.

Radar pulses spread out as they move away from the radar station. This means that the region of air any given pulse is moving through is larger for areas farther away from the station, and smaller for nearby areas, decreasing resolution at far distances. At the end of a 150–200 km sounding range, the volume of air scanned by a single pulse might be on the order of a cubic kilometer. This is called the pulse volume.

The volume of air that a given pulse takes up at any point in time may be approximately calculated by the formula \, {v = h r^2 \theta^2}, where v is the volume enclosed by the pulse, h is pulse width (in e.g. meters, calculated from the duration in seconds of the pulse times the speed of light), r is the distance from the radar that the pulse has already traveled (in e.g. meters), and \,\theta is the beam width (in radians). This formula assumes the beam is symmetrically circular, "r" is much greater than "h" so "r" taken at the beginning or at the end of the pulse is almost the same, and the shape of the volume is a cone frustum of depth "h".
 
He said that the wavelength determines what you see, long water waves "wrap around" piers and continue undisturbed on the other side. shorter wavelength don't "wrap around" and are reflected. I can't see around a corner but I can hear around the same corner because light has a short wavelength and sound is much longer. By increasing the radars frequency the wavelength become shorter and vice versus. tuning the radar allows you to "see" different things, like water droplets for example.
Few droplets mean few returns and lots of droplets lots of return "echo". computers can assign "colors" to these return energies. Allowing you to see storm intensity
Droplets, ice crystals, snow flakes return different echos computers can again assign color to these returns. Allow you to "see" where it is raining, freezing rain, and snowing
Object moving toward the radar return a higher frequency than objects receding from the radar, the Doppler Shift, the degree of shift relates to the speed of the objects. Thus Doppler radar can tell if part of a cloud is moving toward the radar while another part moves away (rotation) computers again assign colors to the varying frequencies
As to the energies, throw a rock into a pond. as the wave front distance increases the energy per unit of area decreases because the circle is bigger. with radar it is no longer a circle but becomes a hemisphere, therefore the energy decrease is by the square of the distance. It's harder to hear someone talking as you move further away from them. volume (energy content) is decreasing along a hemispherical front. Double the distance and the energy drops by 1/4.
Since the radar pulse is emitted as a directional pulse, the entire hemisphere is not used only a cone shaped region starting at the antenna.
X-band radar is also used to "see" people approaching doors, automatically opening them
Ka-band is used by the police to determine your speed as is K-band. Ku-band in europe
 
Last edited:
When the radar breaks down, they look at the weather rock. if it's wet, it's raining. If it's dry, it's clear. If it's warm, it's sunny. If it's moving, it's a tornado
 
:DMaria, so you have those in Denmark too, cool

Well...I survived the Copenhagen earthquake 2008! :D

8340-250x181crop0.jpg


The red dot shows the epicenter in southern Sweden, and the earthquake measured 4.7 on the Richter scale. :D
I woke up because the doors in my closet rattled, then I got up, turned on the news, and sure enough - earthquake. :D
 
Then you lost your weather rock?
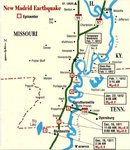
Most people do not think of the midwest US as an earthquake zone but on April 18, 2008, there was a 5.2 earthquake with an epicenter 7 km (5 miles) north northeast of Bellmont, Illinois. The earthquake was about 160 miles (260 km) northeast of New Madrid, Mo The earthquake highlighted activity on the Wabash Valley Seismic Zone fault system that extends from Gallatin County, Illinois, and White County, Illinois, and Posey County, Indiana, northeast 97 km (60 miles) and spans an area that is about 48 km (30 miles) in the Ozark dome region, which covers parts of Indiana, Kentucky, Illinois, Missouri, and Arkansas.
New Madrid, Mo marks the largest earthquake in US recorded history. Between Dec 1811 and Feb 1812 a series of five 8.0+ quakes hit this area changing the course of the Mississippi river making it run backwards for a time
 
New Madrid, Mo marks the largest earthquake in US recorded history.

That cannot be proven, as there were no seismographs in existence in that time period. The largest proven quakes have occured in Alaska. The "good Friday" quake in 1964 is the largest proven quake to have hit a populated region in North America.

Between Dec 1811 and Feb 1812 a series of five 8.0+ quakes hit this area changing the course of the Mississippi river making it run backwards for a time

Ive only seen records for three. And the myth of the Mississippi River running backward was an optical illusion. What was seen were standing waves on the surface running "backwards". The ammount of energy to stop the river and then have it flow backwards is impossible to generate in any conceivable quake.
 
Syscom, agreed, seismographs were not in existence so a definitive Richer number cannot be given but much like the Fujita scale the amount of damage can lead to a pretty accurate number. Things like soil liquidfication only occur at certain levels so I think 8.0 is a pretty reasonable estimate
As to the river I cannot answer and standing waves are certainly possible with the degree of shaking. The rising of a section and the temporary waterfalls indicated could certainly indicate an elevation change in the river bed. My source is pictured below
 

Attachments

  • new-madrid.jpg
    new-madrid.jpg
    82.5 KB · Views: 100
Then you lost your weather rock?
-cut-

Yeah...*pouts*...and he was getting all hand-tame and all. :(
Never mind, I got a new one. Caught 'im in my rock trap and all, it did take some time to get him used to me, but now I can hand-feed him and pet him and all. :D
(Sorry, I was bored stiff here...*giggle*)
 
Maria, don't know your age and I'm not asking but did the "Pet Rock" craze hit Denmark? 'cause it sounds like you had one
 

Attachments

  • lol.gif
    lol.gif
    88.6 KB · Views: 103
This is an article from BCA. The RDR4000M is now fitted to the C130's of the RSAF, superb performance in Europe, also helps to have an EVS fitted as well!!
 

Attachments

  • WXR Article - BCA.pdf
    4.8 MB · Views: 588

Users who are viewing this thread

Back