Trexwyoming379
Recruit
- 1
- Jul 18, 2025
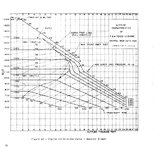
I've noticed that some horsepower/altitude graphs for supercharged engines look like this one for the Spitfire mk 21 (attached below, yes this is a terrible scan of this graph, it is what I could find) where the horsepower increases with altitude and then decreases. Some other horsepower/altitude graphs like the one for the F4U-1A (also attached) are mostly constant with altitude, decreasing before supercharger gear changes. Why is this? What do these engines do differently that causes this?


")