Climb Rate Discrepancies

Ad: This forum contains affiliate links to products on Amazon and eBay. More information in Terms and rules

Zipper730

Chief Master Sergeant
4,430
1,023
Nov 9, 2015
I'm looking at the Hawker Hurricane Mk.I, just the prototype and I've noticed something unusual

Altitude.....Time to Climb.....Time to Climb Interval.....Listed Rate of Climb.....Calculated Rate of Climb
0'..............0 .....min..............0......min..........................2550 fpm.......................N/A
1000'........0.38 min..............0.38 min..........................2600 fpm.......................2632 fpm
2000'........0.76 min..............0.38 min..........................2650 fpm.......................2632 fpm
3000'........1.15 min..............0.39 min..........................2710 fpm.......................2564 fpm
5000'........1.89 min..............0.74 min..........................2810 fpm.......................2703 fpm
6500'........2.43 min..............0.54 min..........................2880 fpm.......................2778 fpm
7600'........2.76 min..............0.33 min..........................2950 fpm.......................3333 fpm
10000'......3.63 min..............0.87 min..........................2680 fpm.......................2759 fpm
13000'......4.8...min..............1.17 min..........................2370 fpm.......................2564 fpm
15000'......5.7...min..............0.9...min..........................2150 fpm.......................2222 fpm
16500'......6.4...min..............0.7...min..........................2000 fpm.......................2143 fpm
18000'......7.25 min..............0.85 min..........................1840 fpm.......................1765 fpm
20000'......8.4...min..............1.15 min..........................1620 fpm.......................1739 fpm
23000'......10.4 min..............2......min..........................1310 fpm.......................1500 fpm
26000'......13.0 min..............2.6...min............................990 fpm.......................1154 fpm
28000'......15.2 min..............2.2...min............................790 fpm.......................909...fpm
30000'......18.1 min..............2.9...min............................570 fpm.......................690...fpm

Why are there these discrepancies?
 
What discrepancies ?
That a particular aircraft, on a particular day, doesn't exactly perform as it was calculated it would do ?

Welcome to the real world, no mechanical device performs exactly the same, day in day out. And no two complex mechanical devices can be exactly duplicated .
They're usually made by humans, and operated by humans.
Even today with all our supercomputers, they still test, and still the aircraft may fall short of, or exceed calculations.
Calculations are estimates only, what you hope it'll do.
Sometimes the designers are close, sometimes they look like idiots.

I remember when NASCAR used to have a race series called the International race of champions, IROC.
They'd take , I think, 12 cars, all of them made by the same maker, equip , them with identical parts.
Every effort was made to get the same performance out of each car.
The drivers from all race series , Nascar, Indy, F1, etc, were put in cars, chosen by lot, and ran several different races. No driver got the same car twice.
Every year, there would always be some cars that was faster than the others, no matter who drove it, and some that were dogs.
 
Last edited:
How is the data collected? Does the pilot scribble it down on a note pad or call numbers out on the radio.
 
Perhaps failure to hold consistent and exact AOA and rudder inputs would have some influence on climb performance, add in tolerances from pitot static system.......
 
It doesn't mention what the pilot was instructed to hold as best climb speed. That's an indicated value and would in physics be only best at one speed/height combination. The pilot's notes will usually say something like 160kts to 8000' then 150 kts. It is simplified for the pilot. Maybe the test pilot is trying to hit best climb numbers regardless of some set 'best speed' but by looking at the rate of climb indicator (which has a built-in lag). The fixed pitch prop will make a difference and be ideal at only one speed at any given height. The pilot is more likely to have a pen recorder for time vs altitude, not having to write it down.

I find the 3333 ft/min rate at full throttle height to be pretty good for a Hurricane, but K5083 was lighter than the production Mk1. It's pretty good at 30000'too.
 
Hi,
In looking at your data it appears that the last column is equal to the difference in altitudes from one step to the next divided by the time interval in covering that step (as listed in column three). As such I'd think that the data in column four is more of an average rate of climb over that step than at actual rate of climb at the altitude listed in column 1.

I tried a quick plot where the average rate of climb for a given step is plotted at the mean height of that step, and the points appeared to fall closer to the other data for lower altitudes but not higher ones. So there might be other factors in play here, but I suspect that one may be that we are trying to compare average rates of climb over a range of height steps, to a plot that potentially trying to relate the estimated rate of climb at given altitudes.

Pat
 
Part of the discrepancy is that column 4 (Listed Rate of Climb.) is the rate of climb at that altitude listed in column 1.

Column 5 appears to be the average rate of climb between two altitudes.

as in the 28,000ft to 30,000ft climb. The discrepancy can be explained by the plane climbing at 790fpm at 28,000ft but the climb rate slowly declines to 570fpm at 30,000ft giving you the average of 690fpm for the 2.9 minute climb.

690fpm is neither climb rate at 28,000ft or the climb rate at 30,000ft. It might be the climb rate somewhere close to 29,000ft.

There may be some other discrepancies that could either be typos or errors in recording data.
Picture of Hurricane altimeter.
hurricane_altimeter.jpg

Picture of rate of climb and decent indicator
b2sjExt1HW9qpoK5kPgJFUk4ET9ml59QR9w-95TQOY6voHnwydTJxXPkNmmaBFE6lcNghzOyhD2TxRRw0j4pQigVZHC2fGmw.jpg


Unless fitted with a special recording instrument you are also depending on the pilots ability to interpret the gauges as they are not marked do any great degree of precision.
 
What discrepancies?
The climb-rate figures don't match. Based on the time it took to reach each altitude mark the plane appears to have reached that rate faster than the VSI reads.

It doesn't mention what the pilot was instructed to hold as best climb speed.
Uh, I just didn't list that because I was curious about discrepancies in climb-rate.

Regardless, the figures are as follows

Altitude....TAS...............IAS...............CAS
0'.............151.5 mph....150....mph....151.5 mph
1000'.......154....mph....150....mph....151.5 mph
2000'.......156....mph....150....mph....151.5 mph
3000'.......158.5 mph....150....mph....151.5 mph
5000'.......163.5 mph....150....mph....151.5 mph
6500'.......167....mph....150....mph....151.5 mph
7600'.......170....mph....150....mph....151.5 mph
10000'.....173.5 mph....148....mph....149.1 mph
13000'.....177.5 mph....144....mph....145.4 mph
15000'.....181....mph....142....mph....143.5 mph
16500'.....183....mph....140....mph....141.6 mph
18000'.....186.5 mph....139....mph....140.7 mph
20000'.....189.5 mph....136.5 mph....138.3 mph
23000'.....195....mph....133....mph....135....mph
26000'.....199.5 mph....129.5 mph....131.2 mph
28000'.....204....mph....127.5 mph....129.4 mph
30000'.....208....mph....125....mph....127....mph
Maybe the test pilot is trying to hit best climb numbers regardless of some set 'best speed' but by looking at the rate of climb indicator (which has a built-in lag).
By built in lag, you mean the altimeter will move slower than the altitude of the plane goes up? If that's the case, wouldn't that actually mean the climb-rates would be higher than I even calculated for? After all, the altitudes would be higher than what the pilot recorded...
The pilot is more likely to have a pen recorder for time vs altitude, not having to write it down.
So, that's how he gets accurate data...
I find the 3333 ft/min rate at full throttle height to be pretty good for a Hurricane, but K5083 was lighter than the production Mk1.
Actually it sort of was, I just used it because it was a chart that was handy and had a discrepancy I noticed.
 
Last edited:
In looking at your data it appears that the last column is equal to the difference in altitudes from one step to the next divided by the time interval in covering that step (as listed in column three).
Altitude in column 1 divided by time in column 3.
As such I'd think that the data in column four is more of an average rate of climb over that step than at actual rate of climb at the altitude listed in column 1.
That's the figures that were listed for the aircraft. I'm not sure how you'd calculate the exact rate of time at any one period. So I just calculated altitude change by interval in time. That said, the climb rate was highest at the aircraft's FTH, so I figured that I was probably right, since R/C was even listed in the chart.
I tried a quick plot where the average rate of climb for a given step is plotted at the mean height of that step
Can you show me what you came up with?

Part of the discrepancy is that column 4 (Listed Rate of Climb.) is the rate of climb at that altitude listed in column 1 . . . Column 5 appears to be the average rate of climb between two altitudes
Well, the discrepancy is that the numbers don't agree with each other (and in some cases it's by over 100 fpm): The calculation I made was simply based on altitude vs time-interval. While calculating over huge altitudes (i.e. 30000 feet / 18.1 minutes = 1657.5 fpm would give figures that are ridiculous -- they'd be far higher than the actual rate of climb at high altitude, and far too low for sea level climb), but since I calculated over several intervals (1000-2000, 2000-3000, 3000-5000, 5000-6500), which range from 1000 feet to 2000 feet between the interval. From 7600-10000 there's a 2400 foot interval, and the highest interval is 3000 feet.
The discrepancy can be explained by the plane climbing at 790fpm at 28,000ft but the climb rate slowly declines to 570fpm at 30,000ft giving you the average of 690fpm for the 2.9 minute climb.
I was under the presumption that at 1000' the R/C listed would be exactly the rate of climb showing on the VSI at that specific altitude, not an average rate of climb between the two of them.
There may be some other discrepancies that could either be typos or errors in recording data.
It seems that the altimeter gauge is reliable by marking to around 50-100'; the VSI seems good to 100-200 fpm increments.
 
Hi,
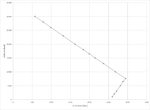
Since a climb rate graph based on the first couple columns would like something like this;
RoC.png

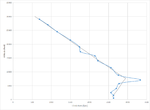
But you appear to be calculating average rates of climb over certain altitude bands, if you then plot the average rate of climb that you calculated for each time step at the average altitude covered by that time step, you end up getting something similar to what is shown below.
RoC2.png

In general the points on the blue line tend to fall fairly close to the grey curve (from above), except near the break in the curve at 7600 ft, where this "knee in the curve" represents a change in available power due to the way the supercharger works.

It is not clear to me yet why the data at/near 7600ft altitude seems a bit high but, I believe that most the other points fall fairly close to the original curve.

Possible reasons for the discrepancies seen at the points (other than near 7600' altitude) may stem from a number of issues, including the accuracy of how the data was measured and any the possibility that corrections/margins that may have been applied during the testing, recording and presentation of the data.

PatRoC.pngRoC2.png
 
P PFVA63

What I find puzzling is that climb rate would fall off at 3000 feet, nor why you'd see higher rates from 5000-6500 feet. Especially with S Shortround6 speculating as to it being the average figure between the altitude range. One would expect that the climb figures would only go up until the FTH and then drop off, even if they were averaging the climb-figures at specified altitudes.

As for the effects of the supercharger performance, I don't know. On one hand throttling losses do occur, but I figure they'd be less extreme on a propeller that doesn't have variable pitch.
  • RPM of the engine would vary across a wider range from low to high altitude on a single-pitch propeller because of efficiency issues
  • Constant-speed propellers usually see around the same RPM across the board: Boost levels vary, but RPM varies little, with the power absorbed by the propeller. With arrangements like that, you end up with a supercharger spinning at the same RPM with huge amounts of restriction to the airflow.
That said: I do remember something to the effect of the supercharger being geometrically (exponentially) related to RPM. This does seem to conform to the power output of jet-engines (almost nothing at low RPM, with almost all the power coming up at high RPM). Regardless, RPM only varies from 2100-2305 throughout the entire altitude range listed (during speed trials, you see around 2505-2960), which isn't a massive change in RPM: When the Constant-Speed propeller was fitted to the Hurricane, general ranges cited for climb and speed trials were 2600-3000
 
..Unless fitted with a special recording instrument you are also depending on the pilots ability to interpret the gauges as they are not marked do any great degree of precision....

There is also situations where a pilot's unfamiliarity with certain instruments and the use of different correction data may skew test results:

....In an independent trial the U.S.A.A.F. obtained slightly higher figures, possibly owing to the difficulty of reading the Standard American airspeed indicator and to the different methods of reduction. At this Unit the British Performance Reduction Methods for Modern Aircraft (A. &A.E.E./Res/170) were used....

P-47 Tactical Trials
 
When I took rotary flight training in the earl 70's, and fixed wing in the 90's, I was told both times by instructors that all pressure reading flight instruments ( altimeter, rate of climb, air speed ) have a lag between what they display and exactly what's going on in that instant of time.
Especially if you're in a rapidly climbing aircraft and see 5000 feet on the altimeter, you were actually there a few seconds before that.

I doubt the flight gauges of the late 30's were any better.

I doubt those notes were taken by a test pilot on a clipboard in the cockpit, because if it was he'd be awfully busy in the first part of the climb, making estimates of rate of climb off a indicator incremented in 500 fpm when it's above 2000 fpm, and making these notes every 20-25 seconds. While flying at full power, so he'd also have to be monitoring the engine instruments pretty close too.

Just how stable would the automatic recording instruments have been in the late 30's, wouldn't they just as lag prone as the regular flight instruments ?

Then the aircraft was flown in a real world .
How was the weather? wind gusting ?
 
There is also situations where a pilot's unfamiliarity with certain instruments and the use of different correction data may skew test results:

....In an independent trial the U.S.A.A.F. obtained slightly higher figures, possibly owing to the difficulty of reading the Standard American airspeed indicator and to the different methods of reduction. At this Unit the British Performance Reduction Methods for Modern Aircraft (A. &A.E.E./Res/170) were used....
How did they reduce the data?

When I took rotary flight training in the earl 70's, and fixed wing in the 90's, I was told both times by instructors that all pressure reading flight instruments ( altimeter, rate of climb, air speed ) have a lag between what they display and exactly what's going on in that instant of time.
Especially if you're in a rapidly climbing aircraft and see 5000 feet on the altimeter, you were actually there a few seconds before that.
So, there was clearly a lag in the time to climb figures.

Was there any evidence to suggest that there were differences in the lag-rates used by different gauges in different nations?
I doubt those notes were taken by a test pilot on a clipboard in the cockpit, because if it was he'd be awfully busy in the first part of the climb
That makes sense, do you have any idea how they recorded the data?
 
Last edited:
Hi,
I didn't mean to imply that the supercharger was a potential cause for the variation in the points. What I was trying to say was that there is a "knee" in the curve because of the supercharger. In other words, below the altitude that the "knee" occurs, I believe, that you are able to apply full power from the engine (because of the supercharger), but above that altitude the amount of power that the engine is able to put out begins to drop with altitude.

Regards
Pat
 
I didn't mean to imply that the supercharger was a potential cause for the variation in the points.
Well you said it. That said, I figured it was an attempt at a guess.
In other words, below the altitude that the "knee" occurs, I believe, that you are able to apply full power from the engine (because of the supercharger), but above that altitude the amount of power that the engine is able to put out begins to drop with altitude.
Actually, the power output below that altitude would be less, owing to throttling loss (they occur because the airflow to the supercharger is sub-optimal with the airflow-restriction).

Manifold pressure would be maxed out until critical altitude is reached.
 
Hi,
I disagree. Here is a direct quote of my earlier post (with underlining and bolding for emphasis);

"In general the points on the blue line tend to fall fairly close to the grey curve (from above), except near the break in the curve at 7600 ft, where this "knee in the curve" represents a change in available power due to the way the supercharger works.

It is not clear to me yet why the data at/near 7600ft altitude seems a bit high but, I believe that most the other points fall fairly close to the original curve.

Possible reasons for the discrepancies seen at the points (other than near 7600' altitude) may stem from a number of issues, including the accuracy of how the data was measured and any the possibility that corrections/margins that may have been applied during the testing, recording and presentation of the data."

Nowhere in the above text (that I can see) do I appear to state anything about the supercharger being "a potential cause for the variation in the points".

Regards
Pat
 
One of the things I have noticed over the years is the presence of typos in the original documents. In this case the 3333 ft/min in the calculated climb rate column should be 2833 ft/min, and the 2564 ft/min should be 2654 ft/min. It is remotely possible that this is due to miscalculations, but I would bet it is simply typos - either in the original calculation results chart, or when the results were transcribed to the performance test chart.
 
One of the things I have noticed over the years is the presence of typos in the original documents.
The numbers I posted came from calculating altitude versus time. The listed climb-rate figures are on column four. There wasn't any errors except the fact that I rounded...
 
Last edited:

Users who are viewing this thread

Back