Huh? And double huh? Where are you getting that?
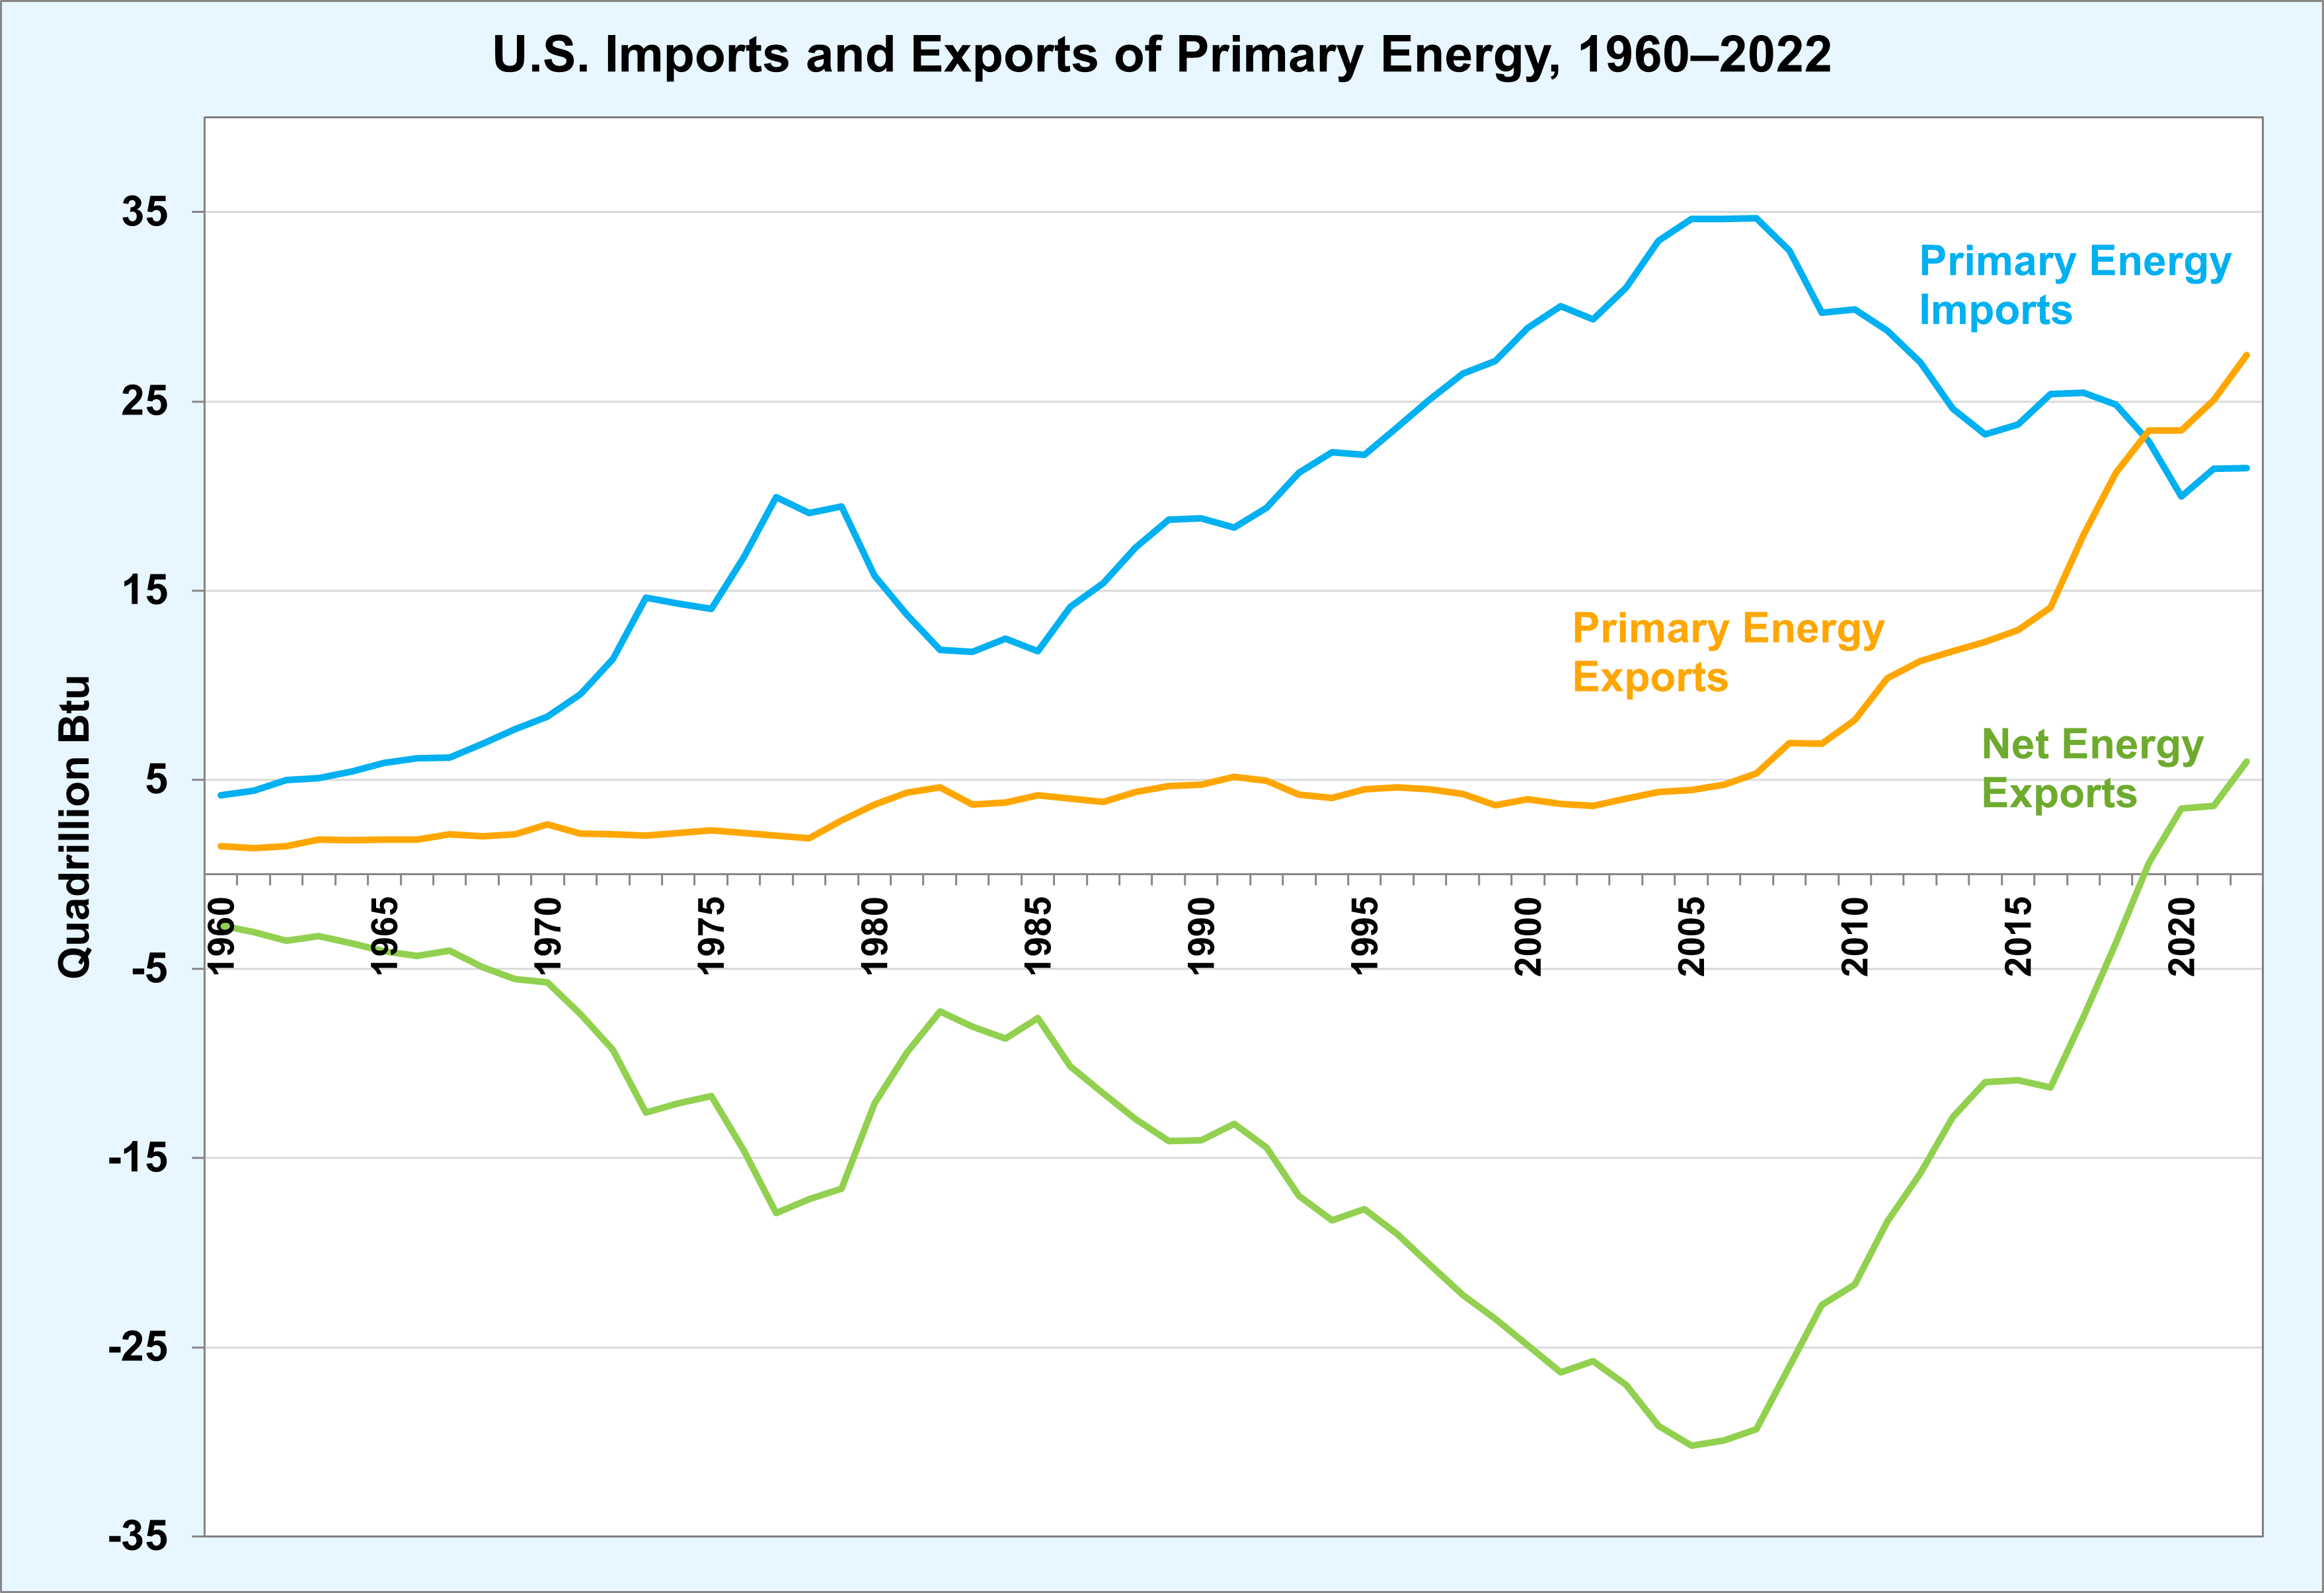
The US wasn't energy independent in 2020, but it was a net energy exporter. The US still relied heavily on oil and natural gas imports in 2020 to meet its liquid fuels need. The USA of 2023 is a little less dependent on foreign imports and this trend will continue. That's thanks to broadly flat domestic consumption over the past two decades, and massively increasing domestic production.
At the moment, the US is:
A) Producing more energy than it ever has. Energy production has gone from ~70 quadrillion BTUs in 2005 to ~103 quadrillion BTUs in 2022 (and will grow again this year). Meanwhile consumption has almost static since 2005, at roughly 100 to 103 quadrillion BTUs.
B) Importing less energy overall than at any point since the mid 1990s and proportionally less (share of energy mix) than at any point since WW2.
C) Enjoying its largest ever energy production surplus and exporting more energy than it ever has (a record 4.3 quadrillion BTUs exported in the year to July 2023, up nearly 40% on 2022 and more than double that of 2021). If net exports are positive in December 2023, it will be the first time since the 1950s that the US has been a net energy exporter for every single month of a calendar year.
Consumption:
2001 US energy consumption: 95.95 quadrillion BTUs
2020 US energy consumption: 92.826 quadrillion BTUs
2022 US energy consumption: 100.325 quadrillion BTUs (2020 to 2022 change: 7.499 quadrillion BTUs (+8.1%))
Production:
2001 US energy production: 71.667 quadrillion BTUs
2020 US energy production: 95.671 quadrillion BTUs
2022 US energy production: 102.923 quadrillion BTUs (Change: 7.252 quadrillion BTUs (+7.6%))
Since 2001, the US has gone from a 24.3 quadrillion BTU production deficit to a 2.6 quadrillion BTU surplus.
The surplus did drop marginally between 2020 and 222 (by 0.2 quadrillion BTUs). But, that's only because domestic consumption fell HUGELY in 2020, because most of the US was locked down in 2020 thanks to COVID!. Refinery capacity dropped from about 90% to about 70% (and is now back above 90%).
US liquid fuels (all types) refinery capacity:
Jan 1st, 2001: 34,491 Thousand barrels per stream day
Jan 1st 2020: 49,317 Thousand barrels per stream day
Jan 1st, 2023: 47,479 Thousand barrels per stream day
Forecast Jan 1st 2024 capacity: 48,900 Thousand barrels per stream day
US petroleum refinery capacity:
Jan 1st, 2001: 14,940 Thousand barrels per stream day
Jan 1st 2020: 16,860 Thousand barrels per stream day
Jan 1st, 2023: 15,624 Thousand barrels per stream day
Sep 1st, 2023: 16,713 Thousand barrels per stream day
All data sourced from the US Energy Information Administration:
Exports of primary energy have increased every year since 2002, starting at 3.6 quadrillion Btu (quads) and rising to 27.5 quads in 2022.

www.energy.gov
U.S. energy imports and exports since 1950.

www.eia.gov
https://www.eia.gov/totalenergy/data/monthly/archive/00352311.pdf (Check page 2)
Sorry, but I have to look at these charts weekly for work and this sort of casual misinformation drives me crazy.