No.It´s not corrected for tailwheel.
so it's a bit conservative, regular production gustav until winter 43 were with retractable tailwheel
Follow along with the video below to see how to install our site as a web app on your home screen.
Note: This feature may not be available in some browsers.
Ad: This forum contains affiliate links to products on Amazon and eBay. More information in Terms and rules
No.It´s not corrected for tailwheel.
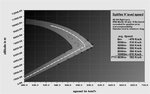
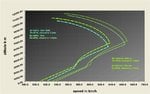
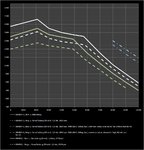
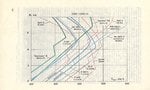
These are a comparison graph shown for all flight test data for the Bf-109G1/G2 in clean fighter configuration that I have come across. Not included are G2/trop and other tests with gunpods/bombs, etc.
A mean curve is shown, too. The Erla tests are corrected for 50mm radiator flap position.
The mean curve appears to be reasonably close to the Messerschmidt specifiction.
Hi Kurfürst,
I am not convinced that the difference between Db-601E and Db-605A is that significant. It´s to some extant true that the FTH for the -605A is higher and it´s output is greater, too. But certainly not to a comparable degree against the -601E´s output at 1.42ata.
The 601E´s power at Sea level and 1.42 ata was 1420 hp, the -605A delivered only 1300hp at 1.3 ata, slightly more than the -601E´s power at 1.30ata, too.
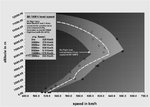
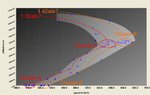
Running a dsicriminance analyis for my dataset of Bf-109G1/2 speed trials aviable, I have come across with some interesting problems, which require an interpretation.
Statistically spoken, the scatter for the Db-605A at Kampf- und Steigleistung does not show a uniform cluster but two rather solated ones.
If I draw two lines around their points respective inertia´s, I get two very neat graphs which agree quite well with the -109F4 datapoints (blue) at 1.30 ata and 1.42 ata, respectively.
Hennig should be able to verify whether or not the lines doe coincide with power related speed calculations on base of the ata-ratings. I know IT DOES cntradict with the information given in few primary sources (ERLA-tests) but I believe there might be a critical explenation for this, more to this later. I would rather like to hear Yours and Hennigs comments first.
How can this be? The DB605 had greater displacement and an improved camshaft for higher RPMs. The engine should be significantly more powerful.the -605A delivered only 1310hp at 1.3 ata, slightly more than the -601E´s power at 1.30ata, too.
Kurfürst, are You sure that the VVS trial was with 1.30ata? A soviet book rates the G2´s engine power at 1475 hp/SL, which would imply 1.42 ata rating for the 666 Km/h figure attained by the test.
Ununderstandably, the altitude rating is given with 1250 hp, altough no specific altitude is mentioned there.
Thanks for the powercurves, btw!
")
Pretty sure. The "TsaGI book" that floats around on the net indeed lists 1475 hp for some reason, but I have the original soviet paper from 1943 and 1944, and it gives in the tables 1310/SL and 1300/5,8km, for both G-2s and the G-4.
Hi Delcyros,
>The speed datapoints are exclusively G1/G2 in clean fighter configuration.
Would it be possible to provide a full list of the datapoint sources?
The reason I ask is that for a comparison, they would have to be normalized, which is only possible if we know the configuration of the aircraft in some detail.
For example, the Finnish G-2 data was not normalized for standard atmospheric conditions, and the engine of the test aircraft was running slightly too slowly due to an inaccurate tachometer.
Kurfürst has an interesting comparison on his website showing the influence of various configuration items, so it might be possible to get normalized and thus comparable data points even where the configuration of the test aircraft differed.
Regards,
Henning (HoHun)
Pretty sure. The "TsaGI book" that floats around on the net indeed lists 1475 hp for some reason, but I have the original soviet paper from 1943 and 1944, and it gives in the tables 1310/SL and 1300/5,8km, for both G-2s and the G-4.
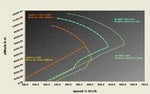
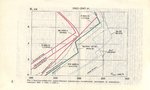
Also if you plot the Soviet climb results with the gunpodless G-2 against other curves known 100% for 1,3ata (Erla, Rechlin Kennblatt, Finn trials), the curves are almost perfect match. Checking climb curves is a good way because its very sensitive to power changes.