Performance figures of Lancaster

Ad: This forum contains affiliate links to products on Amazon and eBay. More information in Terms and rules

ppopsie

Senior Airman
461
6
Nov 15, 2006
East end
Hello all,

I have been wondering about how the performance figures of the Avro Lancaster shown on the each books has been found or defined.

The only thing I knew is that there are no exact performance value, such as top airspeed at specific altitude, maximum range at each weights and climbing performances, clearly printed on the official manuals.

Also how the actual bombing operations during ww2 were planned? That shall include very precisely timed arrival over target, hence the navigation, and fuel plannings for the each aircraft types stationed at each different air bases.

TIA

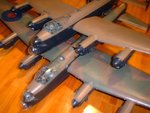
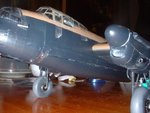
My second Lanc with bulged bomb bay doors will be 80% complete by the next weekend's hobby show.
 

Attachments

  • DSCF0005.JPG
    DSCF0005.JPG
    99 KB · Views: 425
  • DSCF0004.JPG
    DSCF0004.JPG
    77.5 KB · Views: 449
Hi Ppopsie,

>I have been wondering about how the performance figures of the Avro Lancaster shown on the each books has been found or defined.

Do you perhaps have the propeller diameter and the reduction gear ratio for the Merlin XX engines used on the Lancaster? Other than that, a data point for a defined flying condition (weight and power condition) would be helpful.

Regards,

Henning (HoHun)
 
Hi guys, try these out. :)
 

Attachments

  • Lancaster Hercules engines.pdf
    4.7 MB · Views: 313
  • Lancaster Merlin XX.pdf
    518.8 KB · Views: 333
  • Lancaster data.pdf
    15.8 MB · Views: 331
Hi again,

>Do you perhaps have the propeller diameter and the reduction gear ratio for the Merlin XX engines used on the Lancaster? Other than that, a data point for a defined flying condition (weight and power condition) would be helpful.

Here is a quick analysis for a Lancaster with Merlin XX engines.

It's based on the assumption that the engine and the propeller is the same as on the Hawker Hurricane (0.477 reduction gear ratio, 10' 9" propeller diameter) and that the Lancaster is fitted with flame dampers that eliminate exhaust thrust.

The data point I used for calibrating the speed chart is from Karlheinz Kens, "Flugzeuge des 2. Weltkrieges", and displayed as the top speed of the red curve in the diagram.

Regards,

Henning (HoHun)
 

Attachments

  • Lancaster_Speed.png
    Lancaster_Speed.png
    5.1 KB · Views: 476
Thanks everybody,

Thanks Micdrow-sama as usual.

I looked into manuals for the American airplanes like the B-17F and surely there are plenty of performance data and calculation examples are shown for various flight configulations. These are quite similar to today's way.

But there are no such detailed examples shown in the Lancaster manual. Also I note that the determination of inflight CG positions is not included in the pilot's and engineer's notes and left to ground personnel.

Quite interestingly there are no mentioning about the size of the propeller in the Lanc's manual too, whilst the actual figure is specified in the first part of the Hurricane manual.

Therefore I managed to get the size for my model from various photographs and information. You could see a drawing of the outer nacelle which is from production drawings and believed to be fairly accurate. The actual diameter of the spinner can be measured from this.

Applying the size of the spinner to the upper photo, I calculated the diameter to 82.4mm in 1/48 scale, and is almost 13 feet in actual dimentions but this value does not correspond with the figure shown on the lowermost drawing also from the Lancaster manual. However it was appearently for packing and transportation purposes and might have not indicate the sizes very accurately.

I personally see the performance values shown in various books and refrences are possibly from, for example, Jane's but how did Jane's-san got that figures remains.
 

Attachments

  • lancpropdiameter.jpg
    lancpropdiameter.jpg
    165.5 KB · Views: 462
Hi Ppopsie,

>But there are no such detailed examples shown in the Lancaster manual.

Hm, it's my impression that from the handful of small tables and simple diagrams in the typical British Pilot's Notes, it should be possible to prepare the same kind of elaborate tables you find in most USAAF manuals. The BuAer Standard Aircraft Characteristics seem to resemble the British Pilot's Notes in their basic approach - I figure that maybe the USAAF meant to remove one step in the flight planning process by spelling it all out in tables, thus eliminating one opportunity to screw up :)

(It seems that the Luftwaffe approach was a bit like the USAAF approach, though their tables weren't quite as large.)

>Applying the size of the spinner to the upper photo, I calculated the diameter to 82.4mm in 1/48 scale, and is almost 13 feet in actual dimentions but this value does not correspond with the figure shown on the lowermost drawing also from the Lancaster manual.

Using the 13 ft, my performance estimate based on the same data point changes a bit since the propeller loses a bit of efficiency due to high tip Mach numbers. However, that's just for the 5 min emergency settings I listed - at 2650 rpm in the cruise, even the larger propeller would be slow enough to achieve full efficiency.

I have also added the B-17F to the diagram, though I'm not quite sure I have properly understood the relevant Cruise Control Chart ... maybe my figures are off for this one.

Regards,

Henning (HoHun)
 

Attachments

  • Lancaster_Speed.png
    Lancaster_Speed.png
    6.9 KB · Views: 496
Hi again,

>Do you perhaps have the propeller diameter and the reduction gear ratio for the Merlin XX engines used on the Lancaster? Other than that, a data point for a defined flying condition (weight and power condition) would be helpful.

Here is a quick analysis for a Lancaster with Merlin XX engines.

It's based on the assumption that the engine and the propeller is the same as on the Hawker Hurricane (0.477 reduction gear ratio, 10' 9" propeller diameter) and that the Lancaster is fitted with flame dampers that eliminate exhaust thrust.

The data point I used for calibrating the speed chart is from Karlheinz Kens, "Flugzeuge des 2. Weltkrieges", and displayed as the top speed of the red curve in the diagram.

Regards,

Henning (HoHun)

Hi HoHun,

I'm a second year aeronautical engineering student, and we have mostly been dealing with Jet aircraft. For constructing a plot like yours we would find the thrust available, and assume its independent of velocity, but power varies directly with velocity, so I'm wondering how you arrived at this plot? I was, wondering when you calculated the performance values for the Lancaster How did you go about getting the speed values from the engine Data? and which engine Data did you use, I have the values for the Merlin XX from Jane's.

Thanks

i'm sorry to inform you that HoHun has left this forum
 
I extracted this data from an article about Merlin engine development:
Note that the climb figure and thus service ceiling, are at 65000lb, or normal max weight, while the speed figures are 60,000lb for the Lanc III and 62000lb for the Lanc VI.
The article is here:
http://www.wwiiaircraftperformance.org/merlin-lovesey.pdf
 

Attachments

  • Lanc_perf.jpg
    Lanc_perf.jpg
    126.3 KB · Views: 240
Last edited:
Thank you sir!
When I made a small resin model of the Merlin in 1/48 scale for my Lanc few years ago I thought about the mechanisms in the engine. Even though the development of the piston engines during and after WW2 brought it up to such a high level of power and economy, it must have been still inefficient to suck the air, to mix it with the gas, to compress it, to ignite and burn it, to expand it to push down on the pistons which rotate the crank shaft, and the propeller. The propeller transforms the rotation into thrust only at a reduced efficiency. Then I knew what the advancement in the technology mean.

Anyway I will use the chart and article for comparing the aircraft with other types such as the B-17, Mitsubishi G4M, etc. I am now researching on the Mustang either with Allison and Merlin engines.
 
Hi HoHun,

I'm a second year aeronautical engineering student, and we have mostly been dealing with Jet aircraft. For constructing a plot like yours we would find the thrust available, and assume its independent of velocity, but power varies directly with velocity, so I'm wondering how you arrived at this plot? I was, wondering when you calculated the performance values for the Lancaster How did you go about getting the speed values from the engine Data? and which engine Data did you use, I have the values for the Merlin XX from Jane's.

Thanks

Cf - I am not sure which approach HoHun used but as you know, you either need to extract Hp from say a Merlin (correct version and boost) as a function of altitude - to account for the change in critical altitude for each supercharged stage - then have the plots for steadily decreasing Hp as altitude increases (and decreasing RHOalt/RHOsl ratios). These will either be available as manufacturer's bench testing reports - or referenced in the flight tests.

Then on to efficiency of the prop - which will be .8 to .85 for most WWII props in low middle to high speed range. Most of the flight test reports will have data at full throttle until they start testing for max Cruise envelope.

As you probably know from your course study thrust is then obtained as:

T=eta*K*Hp/V

where eta = prop efficiency, K= conversion factor depending on mph, ft/sec or Km/hr, Hp from chart as assumed 100% for that altitude, and V in mph/kph/fps/mps

Below is a nice example of such data and method incorporated in a flight test of a P-51D-15 in June, 1945 - looking at top speeds as well best cruise speeds with external stores. In the latter, the speeds for the resulting boost/rpm and Hp and gross weight with say two 500lb bombs - is compared to clean speed at same rpm/boost and Hp. The latter info gives enough clues to get a pretty good grasp of L/D max to help out in Breguet (sp) equations for max range at those altitudes.

It also gives you the ability to calculate CLmax as they report clean stalling speed for a gross weight, and the ability to calculate Profile Drag with the dash speed on the deck. The dash speed at critical altitude should be carefully considered as the reported speed is right around compressibility drag rise for a P-51 and could obscure the CDo calculation..

P 51D Performance Test

Regards,

Bill
 

Users who are viewing this thread

Back