Sustained Turn Performance Of Piston Engine Aircraft

Ad: This forum contains affiliate links to products on Amazon and eBay. More information in Terms and rules

Hello Badger
one possibility is that the Soviets used their 85 oct fuel during the tests in Spit VB. I really don't know and unfortunately it seems that the Gordon's and Komisarov's book on British a/c in the Soviet service will not be translated to English. Our member VG-33 most probably knows the answer to the fuel used.

Juha

ADDITION: Geust's and Petrov's Red Stars 4 doesn't give the answer but according to it at least some Spit Mk VBs delivered to SU were powered by Merlin 46s.
 
Last edited:
I really don't know and unfortunately it seems that the Gordon's and Komisarov's book on British a/c in the Soviet service will not be translated to English.

I can read Russian quite well, if you have the name of the book, I can see, whether I can find it. From what I see in my books they were Spitfire MkVB with unclipped wings. One of books also mentioned the problems with 100 octane fuel. I will try to look for more Russian sources, as I am almost sure, I have seen some document specifically about testing of Lend-Lease aircraft.

Regards,
badger45
 
"Samoletostroeniye v SSSR 1941-1945, TsAGuI edition 1994. Book two"

Juha

Attached is complete table from that book. I found no mention about conditions of test in the text around. The aircraft is standard Spitfire MkVB with Merlin 46. In the spreadsheet you can find calculation of all turn times and comparison to Russian data. Some data fit well within 5 percent (e.g. P-39Q-15), some are off by 20 percent (e.g. P-39D-2). I think this can be explained only by varied conditions of tests, which were done throughout the war, as the table suggests in heading (different dates). From the Airacobras you can see that the Russian numbers are at least suspicious: P-39Q-15 is quoted with 12-13 percent worse turn times compared to P39D-2, notwithstanding the fact, that it has less weight, same wing and more power (according to the table). I have ran into such unexplainable differences in Russian sources many times. Sometimes the reason is known (I-26-2 has stated turn time 24 seconds, essentially the same aircraft I-26-3 has 20-21 seconds - this time it was due to banking limitations imposed upon I-26-2, because of structural strength problems). Sometimes it is not known :)

If I find more time tomorrow, I can try full analysis of the aircraft, to see whether it can provide better fit to Russian sources. But in case of Airacobra I am sure, I cannot give explanation no matter what I do with the numbers :)

Regards,
Zdenek,
badger45

P.S. BTW very interesting book - thanks for a tip!
 

Attachments

  • sovetskoje_samoletostrojenije.zip
    7.2 KB · Views: 94
Last edited:
Hi All,

since I noticed that there are not only many fans of WWII aircraft, but also many people actually interested in calculation of basic performance indicators, I would like to post some useful equations. I have found the exact approach of aerodynamics engineers quite bothersome to use and tried (successfully) to reduce the equations as much as possible, while retaining sufficient degree of accuracy.

The simplest approach to calculate time to perform sustained turn at 1000 meters height:

t = (W/b) * (Vmax/P)^0,5 * (1/8,80)

where W is weight in kg, b is span in meters, V is max sea level speed in km/h and P is power at the maximum sea level speed (measured in metric horspower, i.e. 735.5 W). The constant is empirically derived, but the rest of the equation follows from following reasoning.

Power (BHP) at full throttle will remain constant but the actual Advance Ratio (J=88 (V)/(rpm*Dia) will be much less for fastest turn near stall. thus 'eta' the Efficiency of the prop will be significantly lower for a full power/near stall/high g constant altitude turn. "eta' for most high performance WWII fighters were near .85 for max speed, level flight but closer to .67 for high/near stall/max rate turn in equilibrium....with T=D

Time to perform sustained turn is inversely proportional to turn rate, which is defined as g*[(n^2)-1)]^0.5/V (g is 9.81 m/s2, n is load factor in g's and speed in m/s in sustained turn).

The speed in sustained turn is
V = [(P*eff*735.5)/(2*ro*S*Cd0)]^(1/3) m/s
and the load in sustained turn is
n = 0.687 * {[(P*eff*735.5)^2*E*ro*S*K]/W}^(1/3) m/s2

P is metric horsepower, eff is propeller efficiency coefficient, ro is air density in kg/m3, S is wing area in m2, Cd0 is zero lift drag coefficient, E is aircraft maximum lift-to-drag ratio, K is induced drag coefficient and W is weight in kg.

In level flight for such a condition, the Power would not be maximum, the efficiency of the prop/powerplant would be below maximum. It will not be at the same velocity at CLmax in a high g turn, and the velocity of the turn will be much less than at the low Drag point for level flight. Further, and important is the fact that Darg due to Lift mast also account for the trim drag of the large rudder and elevator deflections necessary to keep the airplane in level flight. These factors tend to Decrease the Oswald efficiency 'e" and vary with AoA. They are reasonably small but not insignificant in this manuever

K = pi*AR*oswald (oswald means Oswald span efficiency)
AR = b^2/S
E = [(K/Cd0)^0.5]/2

The CDparasite at max speed decreases slightly from max speed at max power at critical altitude all the way down to the deck.

For example if you use these tables for P51D-15 from NAA report of June 15, 1944 P 51D Performance Test
and perform the equations to balance T=D, calculate thrust, check advance ratio and activity ratio to ensure 'eta' stability at .85, methodically select different altitudes and calculate for 'q', calculate CDtotal, calculate Cdi, calculate Cdp you will find:

Alt==Vel==power= W==Cd===CL==Cdi===CDp
26K 442 1410 9590 .02856 .231 .00362 .0249
22K 428 1410 9615 .0252 .206 .00288 .0223
10K 417 1700 9660 .02018 .134 .001219 .0189
SL 375 1630 9700 .01829 .114 .000888 .0174

The flat plate drag decreases from 6.67ft>>2 @26K to 4.313 @SL (these are my calcs w/o any change to oswald efficiency (=.8) or need to change eta (=~.85-86) and I used total Thrust including exhaust (Delta) thrust assumed at .12 Thrust where Thrust = eta (550) (Hp)/(mphx1.467) + Delta Thrust.


Assuming that propeller efficiency and Oswald is constant for all aircraft (not exactly true) and we are moving at sea level, we can rewrite the above equations without numerical constants (i.e. rewrite just variables, ~ denotes "is in proportion to") as:

Check out propeller efficiency 'eta' when a/c in steep/high g bank at constant velocity near stall - your efficiency is nowhere near the same full load engine/prop in level flight at max speed.

V ~ P^1/3 * S^(-1/3) * Cd0^(-1/3)
n ~ P^2/3 * S^(1/3) * Cd0^(-1/6) * K^0.5 * W^(-1)

Cd0 can be estimated numerically, using formula Cd0 = Cd - Cl^2/K, but for the purpose of further simplification it can be assumed as equal (in max speed level flight) to total coefficient of drag. Error from this assumption is negligible (on the order of less than 1% accuracy in final time to turn computation). This is because of the 90 percent share of Cd0 in total drag (as long as you take max speed level flight conditions).

BUT you do not have max speed level flight in high g turn near stall - and CD0 and CDi are much closer to equal. This is a huge assumption flaw.


Total coefficient of drag is proportional to P * Vmax^(-3) * S^(-1), where the Vmax denotes sea level max speed. Inserting this into equations above (and assuming, that the turn is done at maximum power) we get:

V ~ Vmax

This is not that much surprising.

It should be EXTREMELY surprising. I haven't yet calculated all the parameters for the Mustang cited above, but so far my calculated Speed was ~ 160MPH at CLmax = 1.8 (@ stall speed) and the drag is awful in that high angle of attack. This correlates with Deans America's 100K, page 603

Further, in this range the elevator and rudder deflections are high to keep the aircraft in a levele constant altitude and constant speed turn. The calculated 'N' ~ 2.99 g, 18.9 degrees/sec ---> 19sec for 360 degree turn. I need to check these figures but won't have time for a couple of days.


Speed for best load sustained turn (at SL) occurs at constant percentage of max speed for that altitude, usually 64 percent. Variations in actual aircraft seem to be under 1%, when the result was computed exactly with all coefficients. P.S. note that the span loading and speed-to-power coefficients are after all the only things that affect the aircrafts turning rate.

CLmax extremely important, drag also very important - have no clue where you derive "64%" value but am interested if you have a source that tabulates the results.

Thus it seems that the turn time was really more or less unsubstantial characteristic in WWII design, since every aircraft designer in a quest for performance sought to maximize these and thus inevitably worsened turning characteristics of aircrafts.

Very few designers focused on turn manuverability as a high weight design target. Speed, therefore, drag and power were dominant. For interceptors wing loading and high lift airfoil were thrown in as high priority.
 
Last edited:
Hi again.

1] Right. Change in propeller efficiency is really not in the formula and it may be a factor degrading sustained turn times. Varying eta from 0.8 to 0.65 can cause 7 percent increase in sustained turn time and even greater 12 percent increase in time to perform max g sustained turn. From comparing my data to set of approximately 60 Russian tests I estimate it is more like 5 percent in real world. This is one thing I want to improve in formulas. This way they give consistently optimistic results (for all aircraft though).

2] Maximum lift to drag emerges in the formula because of arithmetic derivation from steady state turning flight formulas. It does not actually mean, that the flight uses max lift to drag (that really occurs at about cruising speed usually). It is a placeholder for 1/(2*K*Cd0)^0.5.

3] Trim drag is abstracted from the model (i.e. not by me, but by Raymer, Ojha, Hale and others). Probable reason is it's negligible contribution (1-3 percent according to Roskam IIRC). As we are dealing with aerodynamically similar aircraft, this omission should not be significant in the results. Much greater errors appear e.g. from weight and engine data unreliability.

4] The CDparasite at max speed decreases from max speed at max power at critical altitude all the way down to the deck.
That is quite surprising, don't you think? ;) Raison d'etre of this coefficient is its quite stable nature (given subsonic flight at cca M<0.6). Although it slightly changes as a function of angle of attack and Reynolds number, it should not be such a huge change. This suggests some errors in your calculation. My ideas what is wrong with your calculation:

a) BHP is not the horsepower you can use (as you can see from constant BHP at 22 and 26 kf). You have to use shaft horsepower, which is not equal in two heights on the same supercharger stage and gear ratio.

b) use ISA (international standard atmosphere). E.g. your CL at 26 kf is wrong by 12 percent (using ISA it looks like 0.189 not 0.214).

c) since you haven't posted formula for exhaust thrust, I can only guess, what are the values for exhaust thrust you used in calculating total drag. And because you used strange atmosphere in calculating CL I cannnot reliably derive it back from Cd's. But if you used ISA, then it seems like you calculate additional 1975 N of exhaust thrust at 26 kf! Unless P-51D was the first jet in the sky, I think the value should be more conservative. Especially since it looks like you used exhaust thrust even at sea level (about 800 N).

5] Many of your remarks (about stall speed, Cl max and so on) still aim at fastest sustained turn conditions. Formula (V/P)^0.5*W/b*(1/8.80) approximates some other thing. It is used to find such sustained turn time, at which the g-load is maximized. This does not usually occur at stall. If you want to calculate fastest sustained turn (maximizing turn rate, instead of g-load), use second formula 2.47/((P*V*S^2*b^2)^0.25/W).

Regards,
Zdenek
badger45
 
Hi again.

good to chat

1] Right. Change in propeller efficiency is really not in the formula and it may be a factor degrading sustained turn times. Varying eta from 0.8 to 0.65 can cause 7 percent increase in sustained turn time and even greater 12 percent increase in time to perform max g sustained turn. From comparing my data to set of approximately 60 Russian tests I estimate it is more like 5 percent in real world. This is one thing I want to improve in formulas. This way they give consistently optimistic results (for all aircraft though).

Agreed - and this is one of the major issues regarding assumptions that need to be varied when performing turn manuever calculations.

2] Maximum lift to drag emerges in the formula because of arithmetic derivation from steady state turning flight formulas. It does not actually mean, that the flight uses max lift to drag (that really occurs at about cruising speed usually). It is a placeholder for 1/(2*K*Cd0)^0.5.

Max L/D occurs at ~ 'max' Cruise speed (and correct or best altitude, rpm and throttle setting - and easily picked from the Drag polar where induced Drag crosses parasite Drag and total Drag is at a minimum.. this is one of our very large philosophical differences your choice of boundary conditions where you extrapolate from level flight values and assign them to curvalinear level flight at high G, constant altitude, as the model approaches stall

3] Trim drag is abstracted from the model (i.e. not by me, but by Raymer, Ojha, Hale and others). Probable reason is it's negligible contribution (1-3 percent according to Roskam IIRC). As we are dealing with aerodynamically similar aircraft, this omission should not be significant in the results. Much greater errors appear e.g. from weight and engine data unreliability.

This is 'generally' true -but to model all airframes you need to account for this as '%' here and there' soon become important. By and of itself it is as you say - all Other variables being equal

4] The CDparasite at max speed decreases slightly from max speed at max power at critical altitude all the way down to the deck.
That is quite surprising, don't you think? ;) Raison d'etre of this coefficient is its quite stable nature (given subsonic flight at cca M<0.6). Although it slightly changes as a function of angle of attack and Reynolds number, it should not be such a huge change. This suggests some errors in your calculation. My ideas what is wrong with your calculation:

I have been wrong before...see the details below and do your own math to check based on my assumptions?

EDIT - I DID pick the wrong values from the tables - RHO26/RHOsl= .433 - NOT .335
I will re calc the vales below - it always helps to pick the correct column..


a) BHP is not the horsepower you can use (as you can see from constant BHP at 22 and 26 kf). You have to use shaft horsepower, which is not equal in two heights on the same supercharger stage and gear ratio.

http://www.wwiiaircraftperformance.org/mustang/p51d-15342-level.jpg

I purposely picked this June 15, 1945 NAA Report because a.) it is available to all, b.) it has a tabular set of values, c.) the calcs were performed by NAA Aerodynamics group, d.) it has attached plots including the published shaft BHp value 'standards' to eliminate vagaries of a/c condition, instrument error, pilot error. You will note that BHp is constant and if you refer to 'eta' versus J/CP^^1/3 it is right in the .85-.87 range. I used .85

BHp is the power available to the propeller after heat, friction and drive losses. The Power charts reflect the standards for the Packard Merlin 1650-7 as referenced in the above report. You will note 1410 constant from ~ 20,000 through 26,000 feet.

From there the calculation of Thrust follows T= eta*BHp*550/V*1.467 where V in mph is converted to fps.Make your own judgments regarding this thrust value. As to exhaust Thrust delta T=(.011 to .013)Bhp. I used 12% of T pounds to stay conservative but would revert to 12% 'shaft'Bhp if I was developing a model. Reference section 14-3 Fluid Dynamic Drag Hoerner


b) use ISA (international standard atmosphere). E.g. your CL at 26 kf is wrong by 12 percent (using ISA it looks like 0.189 not 0.214).

First - to set the table for the dispute regarding the 26K values and by definition the CDinduced and CDparasite questions.

eta ~ .85 derived by calculating Advance Ratio J and Power Coefficient CP, using 11.16 ft for prop diameter, Prop RPM = 1500 for 3000rpm engine speed with 1:2 for reduction gear ratio (Actual Packard Merlin 1650 was .938:2 but I used 1:2 for simplicity in calculating "N"/1000 value). If I get immersed in these discussions ever again I will build a spreadsheet with precise values for a 'not so precise' set of calculations.

Values for density RHOalt/RHOs are available from many sources but I used the charts and data prepared by Pratt and Whitney and contained in my ever useful "Aeronautical Vest-Pocket Handbook" - twenty first printing dated Dec 1969. Ditto for sea level where Rho = .0023769 lb sec^^2/Ft^^4.

At 26000 feet the ratio is .3557 for US Standard Atmosphere - 1962 for values at STP AGL...

EDIT - actual ratio = .4330 so I will multiply Q values by .4330/.3557 to correct for Q (and all other factors)

So, from the tables V=442mph @1410 Bhp (shaft) 67in Hg, 3000rpm (engine), GW = 9590 lbs, @critical altitude for this engine and boost.

Wing S=Wing Area= 235.75, AR=5.86, from Dean's America's 100,000. Actually various flight test reductions use 233.6 as Wing Area and I use this value first as a conservative approach to yield a higher Induced drag which in turn will yield a lower parasite drag in the resulting calculations.

"q" @26000 = 1/2*RHO*(V)^^2

q= 1/2*(.3557@26K)*.0023769*(442*1.467)^^2
q= 177.72 ---------> edit Q=.4330/.3557 = 229.23 lb/sq ft

Tbhp(shaft)=eta*BHp*550/Vfps
T=.85*550*1410/(442x1.467), T= 1016.6 lbs

Tdelta exhaust thrust= (.11 to .13)*Bhp ---> use .12 -->.12*1410=169.2lbs

Total Thrust = 1185.8 lbs

T=D; = Di + Dp; Assume low angle of attack and Oswald efficiency =.8

D/q=CDt*S = 1185.8/177.72 = 6.67 sq ft flat plate drag @442mph and 26,000 ft

EDIT D/q= 1185.8/229.23 = 5.17 sq ft flat plate drag @26000 feet and 442mph

CL = L/qS = 9590/q*S = 9590/(177.72*233.6) = .2309 --> (you say .189)

EDIT - CL = L/QS=9580/(229.23*233.6) = .0179

Now solve for Parasite Drag and Induced Drag

CDt= (D/q)/S = (1185.8/177.72)/233.6)= .02856

EDIT D/q/S= (1185.8/229.23)/233.6 = .02214

CDp=CDt-CDi = .02856 - CDi

EDIT CDp= .02214 -Cdi

But CDi= (CL^^2)/(pi*AR*e) = (.231)^^2/(3.1416*5.86*.8) .00362

EDIT CDi = (.179)^^2/pi*AR*e) = .00217

Therefore CDp= .02856-.00362 = .02494

EDIT CDp=.02214-.00217 = .01997 - BTW I believe that the higher CDp at top speed at altitude is that the Mustang is in the low drag rise portion of compressibility and that the equation should actually be CD=CDi +CDo +CDc (or CDm)

Using the same process and checking J and CP for eta

The Sea Level values using BHp=1630 @67" and 3000 engine rpm with Rho = .0023769 (RHOalt/RHOsl=1), GW=9700

q=359.65 @375mph; T= 1385.18 + .12(1630) = 1385.2+195.6 =1580lbs = total Drag

D/q=CD*S=4.27 sq ft flat plate drag and a CDt=.01828

CL= (9700/233.6)/q = .1154

CDt=CDi+CDp; CDp=CDt-CDi = .01828- (.1154)^^2/(pi*AR*e)
CDp= .01828-.00090 = .01737

So, Parasite drag at top speed at 26,000 = .02 compared to .017 at top speed at SL, and CL reduces as you would expect due to the much higher density air at Sea Level, therefore a lower angle of attack to sustain level flight.. So, Parasite Drag at top speed is Not a constant along the altitude variable range... 15% is not insignificant. Having said this the Mustang at 442mph TAS at 26,000 feet is entering compressibility range although the NACA Low Drag wing alleveiated the initial onset of compressibility effects.
 
Last edited:
Values for density RHOalt/RHOs are available from many sources but I used the charts and data prepared by Pratt and Whitney and contained in my ever useful "Aeronautical Vest-Pocket Handbook" - twenty first printing dated Dec 1969. Ditto for sea level where Rho = .0023769 lb sec^^2/Ft^^4.

At 26000 feet the ratio is .3557 for US Standard Atmosphere - 1962 for values at STP AGL...
I think you grabbed the pressure ratio (delta = p/psl) value not the density ratio (sigma = rho/rhosl) value at 26kft

0.3557 = delta = p/psl
0.4330 = sigma = rho/rhosl

A Table of the Standard Atmosphere to 65,000 Feet
 
Last edited:
Badger - I assume you have already calculated the RN based on MAC of the Mustang, but for max speed @ 26,000 = 1.18x10^^7 and 2.32x10^^7 at SL Using the tables from the NAA report. RN=q*(V*1.467)*c/3.7373x10^^-7

Thus the parasite drag at SL would increase for the friction drag component of parasite drag over the same value at 26,000 feet (but certainly not much of an increase).
 
Last edited:
Hi again.

1] Right. Change in propeller efficiency is really not in the formula and it may be a factor degrading sustained turn times. Varying eta from 0.8 to 0.65 can cause 7 percent increase in sustained turn time and even greater 12 percent increase in time to perform max g sustained turn. From comparing my data to set of approximately 60 Russian tests I estimate it is more like 5 percent in real world. This is one thing I want to improve in formulas. This way they give consistently optimistic results (for all aircraft though).

also recall that going from full power level flight to the much lower sustained speed turn condition requires a differentiation eta with respect to velocity. You won't have to account for that in your model for constant speed but modelling this for a sophisticated game attempting 'real life' feel would require this.

2] Maximum lift to drag emerges in the formula because of arithmetic derivation from steady state turning flight formulas. It does not actually mean, that the flight uses max lift to drag (that really occurs at about cruising speed usually). It is a placeholder for 1/(2*K*Cd0)^0.5.

Max L/D occurs at the point in the drag polar where minimum thrust is required. The most interesting point here is that Induced drag and Parasite drag are equal - so CDp=CDi.

So, CDi = CL^^2/(pi*AR*e)=CDp..

for the P-51D-15 in the above cited report, they have developed a series of tables for 5,000 and 25,000 to plot various throttle and rpm settings (and corresponding BHp) to obtain speed versus air miles per gallon - also for two 110 gallon tanks and two 500 pound bombs and two 250 pound bombs.


5] Many of your remarks (about stall speed, Cl max and so on) still aim at fastest sustained turn conditions. Formula (V/P)^0.5*W/b*(1/8.80) approximates some other thing. It is used to find such sustained turn time, at which the g-load is maximized. This does not usually occur at stall. If you want to calculate fastest sustained turn (maximizing turn rate, instead of g-load), use second formula 2.47/((P*V*S^2*b^2)^0.25/W).

Regards,
Zdenek
badger45

I suspect we are still at variance with the terms. For a sustained turn at max G load, (attainable while maintaining altitude), the turn rate and speed should be extracted at the point where the highest possible load factor (L/W) is attainable consistent with the lowest possible speed..

Nmax=L/W max = 1/2 rho*(V^^2)*S*CLmax/W

Now, a higher G load may be obtained in a turn with increased velocity for the same bank angle - in which the local angle of attack is less and CL required is less - but that leads to a slower rate of turn and greater radius...

Conversely the Manuever point or Corner point at which CL and N are at the highest possible values without damaging the aircraft - this has the same definition values ----> smallest possible turn radius and largest possible turn rate... but impossible to achieve with a WWII fighter as none of them had the thrust available to take the turn at N = Limit Load.

Vc=SQRT{ (2*Nmax/rho*CLmax)*W/S}

This is the root equation to develop the V-n Diagram.

What am I missing with respect to what you are trying to achieve?
 
Last edited:
Bill, hes on a short vacation.

Ah, I just got a PM to that effect.. I think he (and I) got a little bit frustrated regarding each point of view. Reminds me of Soren and we ended up getting along.

Turn manuever aero is an interesting subject and the 'important details' are subject to debate between very competent aero engineers. My own in depth knowledge has been buried for nearly 40 years until recent engagements in this forum.
 
..one's argument boils down to name-calling, well.........


Since you brought this in public:
In one post...and he is gone. First HoHun and now badger45. I can tell when somebody knows his stuff, and badger45 was one. So thanks a lot for ruining a good conversation.:mad:
 
Last edited:
Step up, Timppa with your resolve. Man up. You have math on your side? Present it.

Or shut the F*ck up.
 
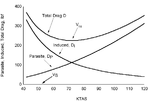
Timppa The two charts presented here are to frame the discussion and the debate I have had with Badger.

First point - Badger is picking total parasite drag from far right of the chart where V=Vmax @max power and propeller efficiency approaches .85 to .87. This is a decent assumption so long as you stay on the right 1/4 of the Drag Polar where the angle of attack is low, the CL is low and Dp approaches peak value. In the far right the CD0 (CDp) approaches .018 to .022 for most fighters and CDi is roughly 10-15% of CDp. Further, for an a/c like the Mustang or Ta 152 or Do335 the aircraft are in the compressibility range at 25000 feet @ max level speed and must be accounted for in the total drag equation

Lets revert to using CD0 to describe all parasite drag including zero lift wing profile drag + friction drag + drag due to bumps, gaps, wheel wells, etc.

Then Total Drag -->CD = CD0 + [r+ 1/(pi*AR*e)]*CL^^2 +CDm . The "r" represents additional Drag due to change in angle of attack and includes trim drag, interference drag, pressure drag due to separation of flow, etc. In This far right region "r" is small as Badger assumed... but calculating CD0 at 25000 feet, without accounting for CDm (compressibility) results in a Higher CD0. I believe I showed that the CDo for the P-51D was different at 25K/442mph and SL/375mph - and that is a direct result of ignoring the 'r' and CDm contributions.

NOTE: I looked at a set of values for Reynolds number and theoretical transitions from Laminar to Turbulent flows where the differences in friction drag coefficient could be expected to be material (i.e. low speed high angle of attack with significant boundary layer build up.

Simply stated - I was wrong in the above dialogue (and Badger was right) regarding negligible difference in CD0 throughout the velocity profile. Whether Badger picks ".02" (reasoable enough for many WWII fighters) or .0176 (for Mustang) the value will be good enough to provide good analysis throughout the velocity profile - whether in level or turning flight. In turn, he will be wrong in assuming that the way he calculated CDo at high altitude/max dash speed will yield the correct value of CDo for all regimes.

My apologies Badger.


It is a bad assumption to think that 'eta' =~ .85 at full power when deep into the stall turn region - where power is at peak, V=~Vstall and n~ highest for minimum radius, max turn rate occurs. In this region of the Drag vs Velocity curve, the 'eta' values are usually ~ .60--65.

As you well know an 'eta' in this low range has a major effect when calculating Thrust to set up the Free Body equations T=D, and must be carefully examined at ma power/low speed around a stall turn.

I just noticed the 'eta' vs J/Cp^^1/3 plot isn't showing up - I will post in next post

Hence - to develop a mid level sophisticated model to solve for Vstall, one has to be careful to develop some notion of the contribution of "r" in the CDi equation, as well as cross check Thrust at the lower efficiency point of J/[Cp]^^1/3 and always keeping in mind that CDi should actually be at the same order of magnitude as CD0 as the Max turn Rate/Max n is at a Vstall much closer to Vcruise than Vstall for level flight - but all to the 'left' of the Minimum Drag point on the Drag Polar. For maximum sustained "G" turn (higher velocity than minimum radius/fastest rate of turn) the profile is usually near the bottom of the drag bucket where L/D is very close to best aero efficiency.

Therefore - These are the reasons behind my 'it ain't that simple' comments of developing Turn Manuever results that very closely approach reliable Test results with known condition of airplanes and powerplants and pilots unafraid of pushing their aircraft to Stall Speed/high g region in sustained 360 degree turn.

The turn manuever equations become simpler with a turboject powerplant and thrust calculations are straight forward. With Piston engine powerplants you are forced to consider more variables for thrust - specifically for low speed/High power as well as density considerations for altitude less than or greater than critical altitude for the turbo/super charged engine... but drag rise must be studed before calculating CDo from max speed at altitude.
 

Attachments

  • drag-p vs airspeed.gif
    drag-p vs airspeed.gif
    10.9 KB · Views: 235
  • eta vs j-Cp.bmp
    493.4 KB · Views: 278
Last edited:
Since you brought this in public:
In one post...and he is gone. First HoHun and now badger45. I can tell when somebody knows his stuff, and badger45 was one. So thanks a lot for ruining a good conversation.:mad:

One post? Are you kiddin??

I suggest finding another sandbox if you don't like this one.
 

Users who are viewing this thread

Back